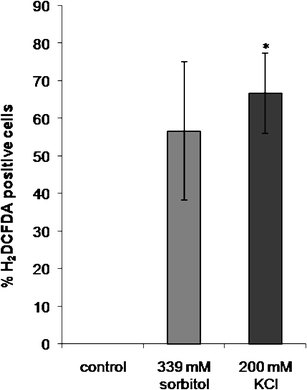
Fig. 1.

ROS production measured by H2DCFDA fluorescence in control Micrasterias cells and after 15 min treatment with 339 mM sorbitol (iso-osmotic to KCl) and 200 mM KCl in confocal laser scanning microscopy. Data are means of three independent experiments + SE. *P < 0.05
