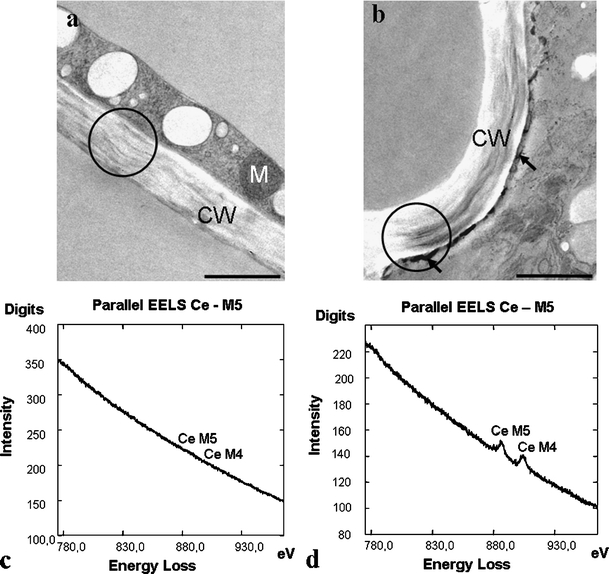
Fig. 2.

TEM micrographs showing ultrastructure of Micrasterias cells pretreated with CeCl3 for H2O2 localization: a control, b KCl-treated cell, cerium perhydroxide deposits at the plasma membrane (arrows). EEL spectra of the Ce M4,5 edge from the circled region in a and b: c control cell, d KCl-treated cell. CW cell wall, M mitochondrion. Bar = 1 µm
