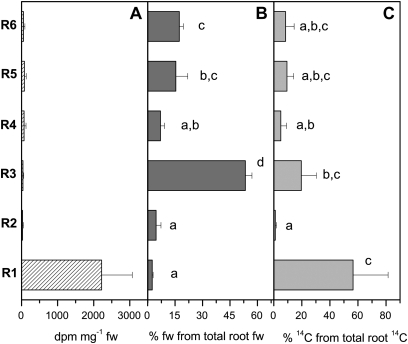
Fig. 4.
Distribution of 14C within the root system 5 h after [14C]ASC was fed to a mature leaf. Data given in A are mean values of dpm mg−1 fresh weight from the three trees analysed. Data given in B are mean values ±SD of the percentage of each root fraction from total root fresh weight. Data given in C represent the amount of 14C from each root fraction relative to total 14C determined in the whole root system that was set to 100%. Different indices indicate significant differences between root fractions at P <0.05.

