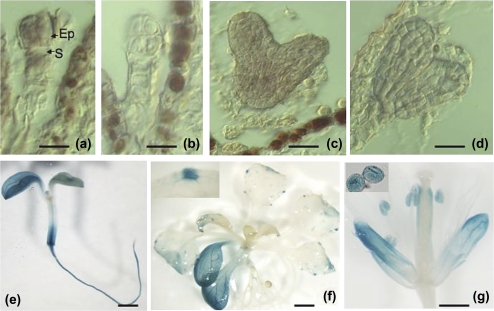
Fig. 4.
Temporal and spatial patterns of TRO gene expression. (a–d) RNA in situ hybridization confirmed the expression of TRO during early embryogenesis. (a) Nomarski micrographs showing a strong signal in the embryo proper (EP) and suspensor (S) at the eight-cell stage. (b) Hybridization with a sense probe at the eight-cell stage. (c) Nomarski micrographs showing a strong signal at the heart stage. (d) Hybridization with a sense probe at the heart stage. (e–g) Histochemical assays of the expression pattern of GUS under the control of the TRO promoter in PTRO–GUS transgenic Arabidopsis. (e) GUS staining of a 7-d-old seedling showing TRO expression in the cotyledons, shoot base and root. (f) GUS staining of a 14-d-old seedling showing TRO expression in cotyledons and hydathodes in a rosette leaf. (g) GUS staining in adult flowers showing TRO expression in pollen grains (inset), anthers, and sepals. Scale bar: a–d, 20 μm; e–f, 1 mm; g, 0.5 mm.

