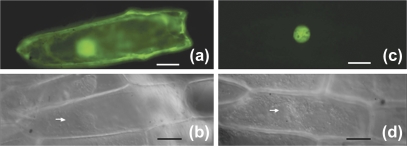
Fig. 5.
Subcellular localization of TRO. (a) Epifluorescence micrograph of an onion cell transiently expressing GFP (35S::GFP). (b) Nomarski micrographs showing the same cell in (a). (c) Epifluorescence micrograph of an onion cell transiently expressing GFP fused to TRO (35S::TRO-GFP). (d) Nomarski micrographs showing the same cell as (c). The white arrow highlights the nucleus. (Scale bar: 20 μm.

