Figure 3.
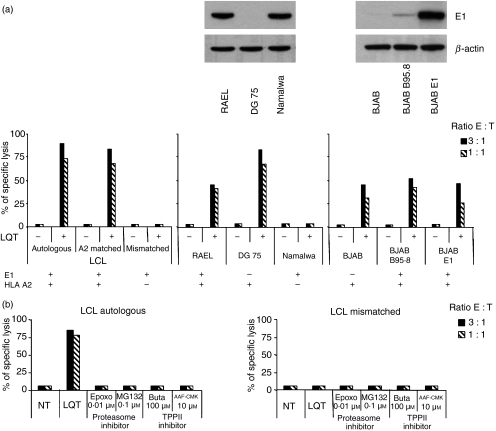
(a) Presentation of the LQT epitope in Epstein–Barr virus (EBV) nuclear antigen 1 (EBNA1) -expressing cells. Left-hand chart: LQT-specific cytotoxic T-lymphocyte (CTL) clones were tested against autologous, human leucocyte antigen (HLA) -A2-positive single-matched and mismatched untreated or LQT-pulsed lymphocyte cell lines. Results are expressed as the per cent specific lysis obtained at an effector : target ratio of 3 : 1. One representative experiment out of three is shown. Central chart: LQT-specific CTL clones were tested against HLA-A2+, EBV+, HLA-A2+ EBV– and HLA-A2– EBV+ untreated or LQT-pulsed Burkitt’s lymphoma (BL) cell lines. Results are expressed as the per cent specific lysis obtained at an effector : target ratio of 3 : 1. One representative experiment out of three is shown. The upper panel depicts expression of the EBNA1 antigen, as detected by Western blot analysis. β-Actin was used as loading control. Right-hand chart: LQT-specific CTL clones were tested against a panel of BJAB cells including untreated or LQT-pulsed HLA-A2+ EBV– BJAB, HLA-A2+, EBV+ BJAB B95.8 and HLA-A2+ EBNA1+ BJAB E1 cells. Results are expressed as the per cent specific lysis obtained at an effector : target ratio of 3 : 1. One representative experiment out of three is shown. In the upper panel, expression of the EBNA1 antigen, as detected by Western blot analysis, is shown. β-Actin was used as loading control. (b) Effects of the proteasome and TPPII inhibitors on the LQT generation. CTL LQT clones were tested against a panel of lymphocyte cell lines (LCL) treated or not with specific proteasome and TPPII inhibitors. LCL HLA-A2 mismatched was used as a control. As a positive control the LQT peptide was added at the concentration of 10−5 m. One experiment out of three is shown. Inhibition of proteases was confirmed by in vitro assay (data not shown).

