
Figure 2e:
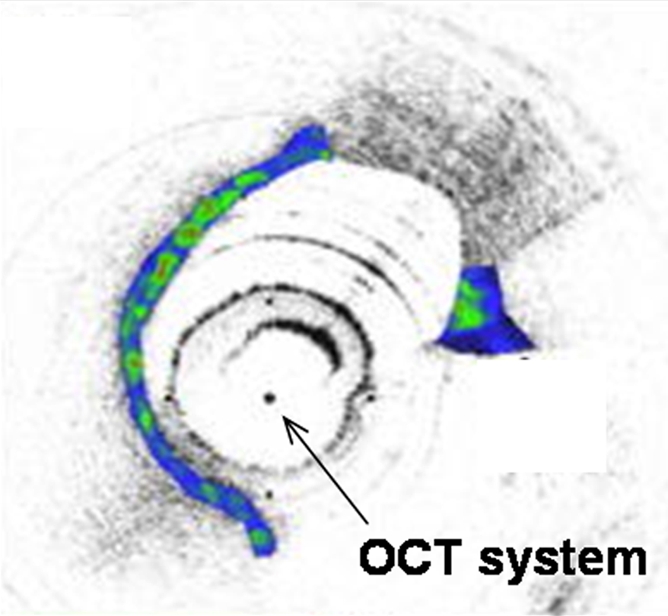
(a) Schematic of motorized pullback OCT image wire system. This system consists of a 0.016-inch image wire (solid arrows) with a balloon occlusion (open arrow). P = plaques. (b) Cross-sectional OCT image of a vessel. (c) Cross-sectional intravascular US (IVUS) image of a vessel. The luminal border (open arrows) is unclear because of wedging of the intravascular US imaging catheter. In contrast, the luminal border (open arrows in b) is clearly visualized on b. (d) Cross-sectional OCT image of an atheroma in the coronary artery obtained in vivo in a patient with acute myocardial infarction. L = lipid pool. (e) Once the OCT image of the atheroma is obtained, macrophage infiltration and density data from the fibrous cap can be displayed with pseudocolor. (Modified and reprinted, with permission, from references 7 and 8.)