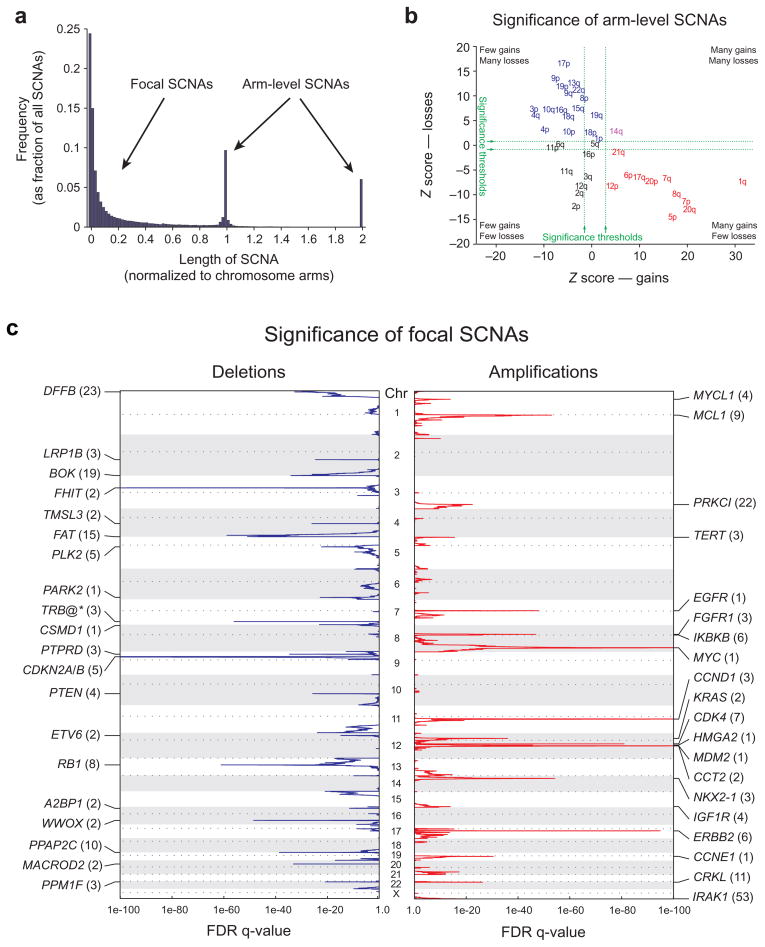
Figure 1.
Identification of significant arm-level and focal SCNAs across cancer. a) Length distribution of SCNAs. b) Length-adjusted Z-scores for gains (x-axis) and losses (y-axis) of indicated chromosome arms. Arms in red, blue, purple, and black exhibit significant gain, loss, both, or neither, respectively. c) GISTIC q-values (x-axis) for deletions (left, blue) and amplifications (right, red) are plotted across the genome (y-axis). Known or putative gene targets within the peak regions (TRB@, indicated by an asterisk, is immediately adjacent) are indicated for the 20 most significant peaks; values in parentheses represent the number of genes in the peak region.

