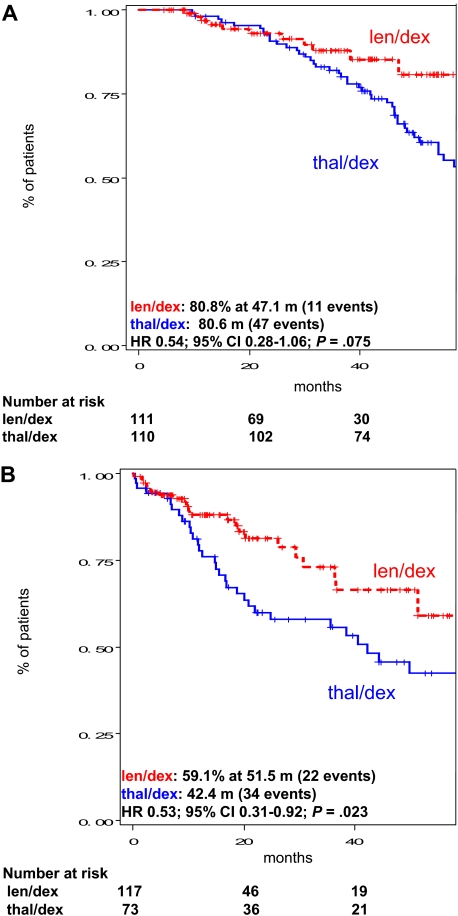
Figure 4.
Subgroup analysis of OS in the intention-to-treat population of patients treated with len/dex and thal/dex according to transplantation status. (A) OS in patients who received transplantation. (B) OS in patients in patients who did not receive transplantation. Median OS is provided in the figure. m indicates months.

