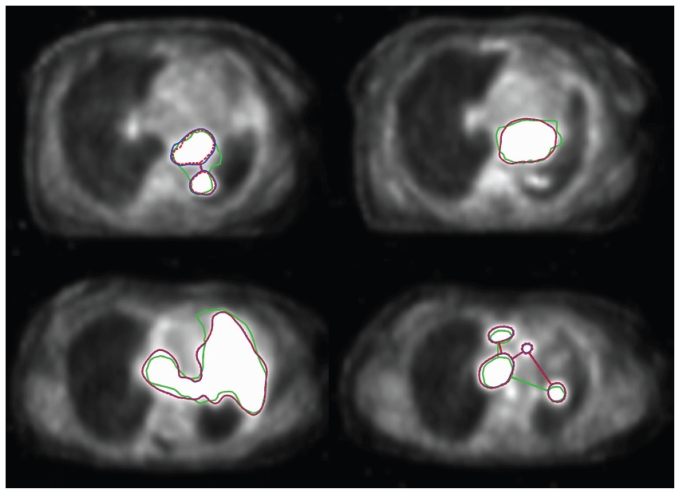
FIGURE 5.
Segmentation examples in the gated pet (left: patient 1; right: patient 2). Green contour = gross tumour volume (gtv); blue contour = region contoured by the reference standardized uptake value (suv) threshold; dashed red contour = region contoured by the support vector machine–based algorithm prediction using the suv threshold.

