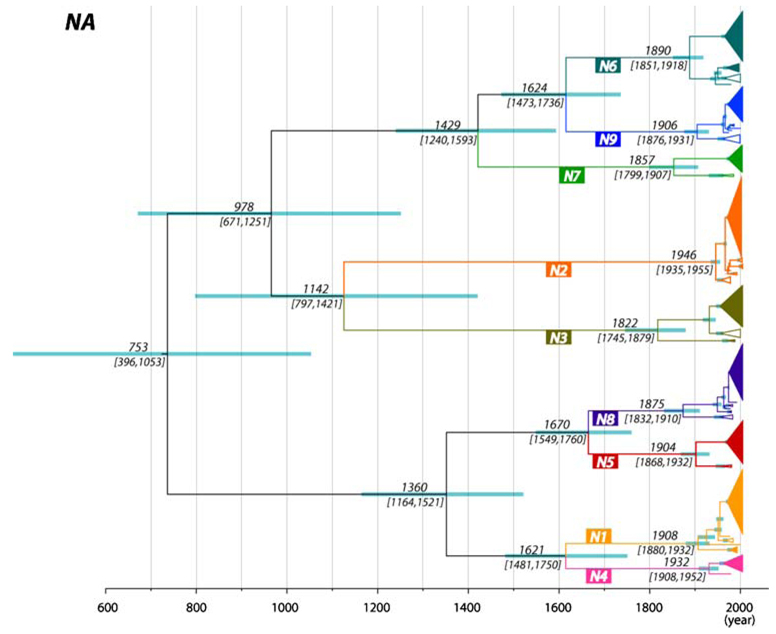
Fig. 2.
MCC tree of the NA segment of AIV. Subtypes are represented by different colors, with geographic clusters collapsed and depicted as triangles when possible. The filled triangles represent North America strains, whereas hollow triangles represent Eurasia/Australian strains. The median node ages and their 95% HPD values are shown on the major nodes, with 95% HPD values shown as node bars

