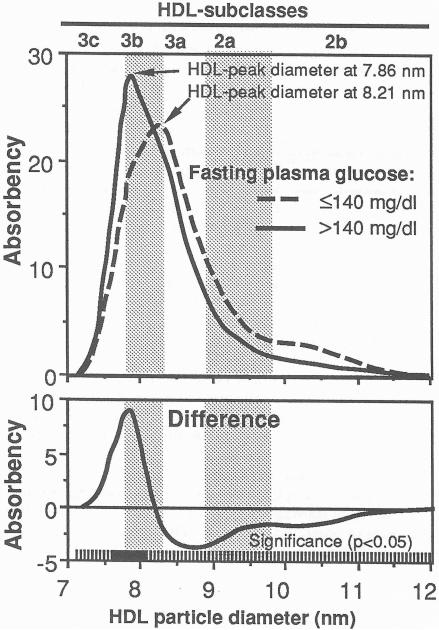
Fig 1.
Mean absorbency of protein-stained HDL by particle size in four untreated non-insulin-dependent diabetic men (fasting plasma glucose > 140 mg/dL) and 93 nondiabetic men (top)), and the mean differences between diabetic and nondiabetic men (bottom). The curves were computed by averaging the heights of the individual HDL distributions at each diameter value. The solid portions of the bar at the bottom of the graph designate those diameter values that achieve statistical significance for the differences (P≤ 0.05) for two sample t test. The predominant HDL peak diameters are indicated, and the subclass intervals defined by Blanche et al [1] are provided for reference. The untreated diabetics had significantly smaller HDL peak diameter (mean ± SD: 7.86 ± 0.06 vs. 8.21 ± 0.20 nm) than nondiabetic men and significantly higher HDL3b,

