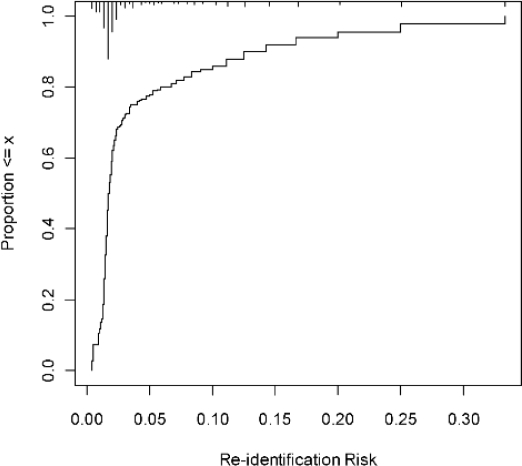
Figure 4.
Ascending cumulative distribution plot showing the proportion of records with an actual re-identification risk below the x axis values. The proportion of records with a risk of 0.33 or less is 100%. However, as many as 95% of the records have a re-identification risk at or below 0.2. The histogram along the top axis shows the density of records with specific levels of re-identification risk. In this case, the majority of records are concentrated at the low end of re-identification risk.

