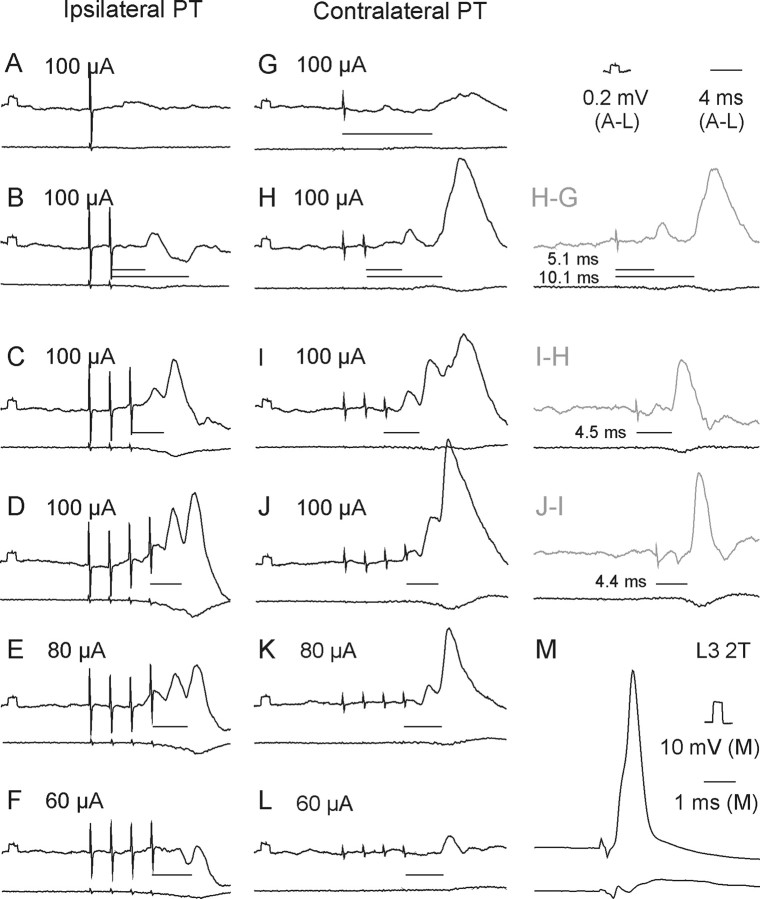
Figure 3.
Examples of EPSPs evoked from the ipsilateral and contralateral PTs. Upper traces in A–M are intracellular records from a motoneuron in a preparation with the spinal cord intact. Lower traces are simultaneously obtained cord dorsum potentials. Averages of 20 records. A–D and G–I, EPSPs evoked by increasing numbers of stimuli at the same intensity (100 μA). D–F and J–L, EPSPs evoked by decreasing intensities of a train of four stimuli. M, Record of an action potential antidromically evoked by stimulation of nerve branches of the third lumbar (L3) nerve. Records to the right of H–J show differences between effects of two and one, of three and two, and of four and three stimuli, respectively. In this and the following figures the negativity is down in intracellular records and up in records from the cord dorsum. Rectangular pulses at the beginning of the intracellular records are calibration pulses. Horizontal lines indicate latencies of potentials evoked by the last stimuli.

