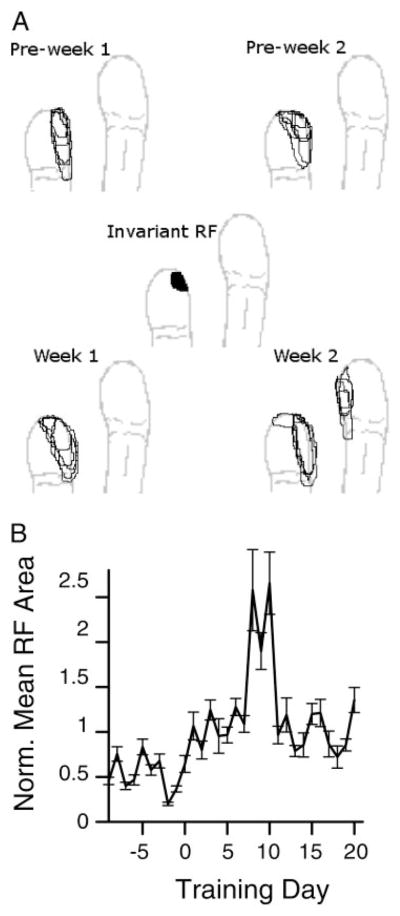
FIG. 3.
Receptive field changes over time. A: receptive field maps from 1 site from 2 wk before the behavior was initiated and 2 wk after. Center plot shows the intersection of all 20 receptive fields. B: normalized receptive field area during training. Receptive field area from each site with a significant tap response was taken from 2 wk before training started to 4 wk after, and each site’s areas were normalized to a within-site mean of 1. Average normalized areas across all sites that responded to the behavioral taps are shown. Areas were significantly larger after training began than before (t-test on normalized areas, P < 10−7). Areas without significant tap responses had insignificant areal changes before and after behavioral initiation.

