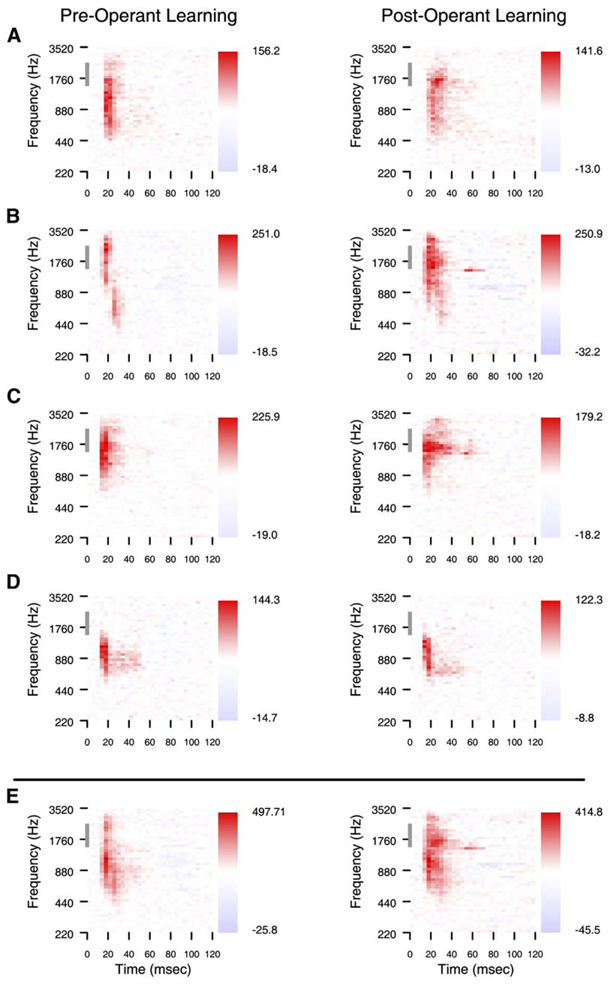
Figure 6. Matched Neural Responses before and after Operant Conditioning.
(A–D) Single-site examples of change. Four pairs of single-site examples of change from animal two are shown. The tonal receptive fields on the left are taken from 1 day before initiating the instrumental learning behavior, and the receptive fields on the right from the same four sites are taken 2 weeks later. The gray bar on the ordinate indicates the frequency range of the conditioned stimuli. The distractor frequency was 1109 Hz. Each receptive field is independently normalized to its maximum and minimum.
(E) The compound receptive field shows the sum of all single-site receptive fields from the same two recording days.

