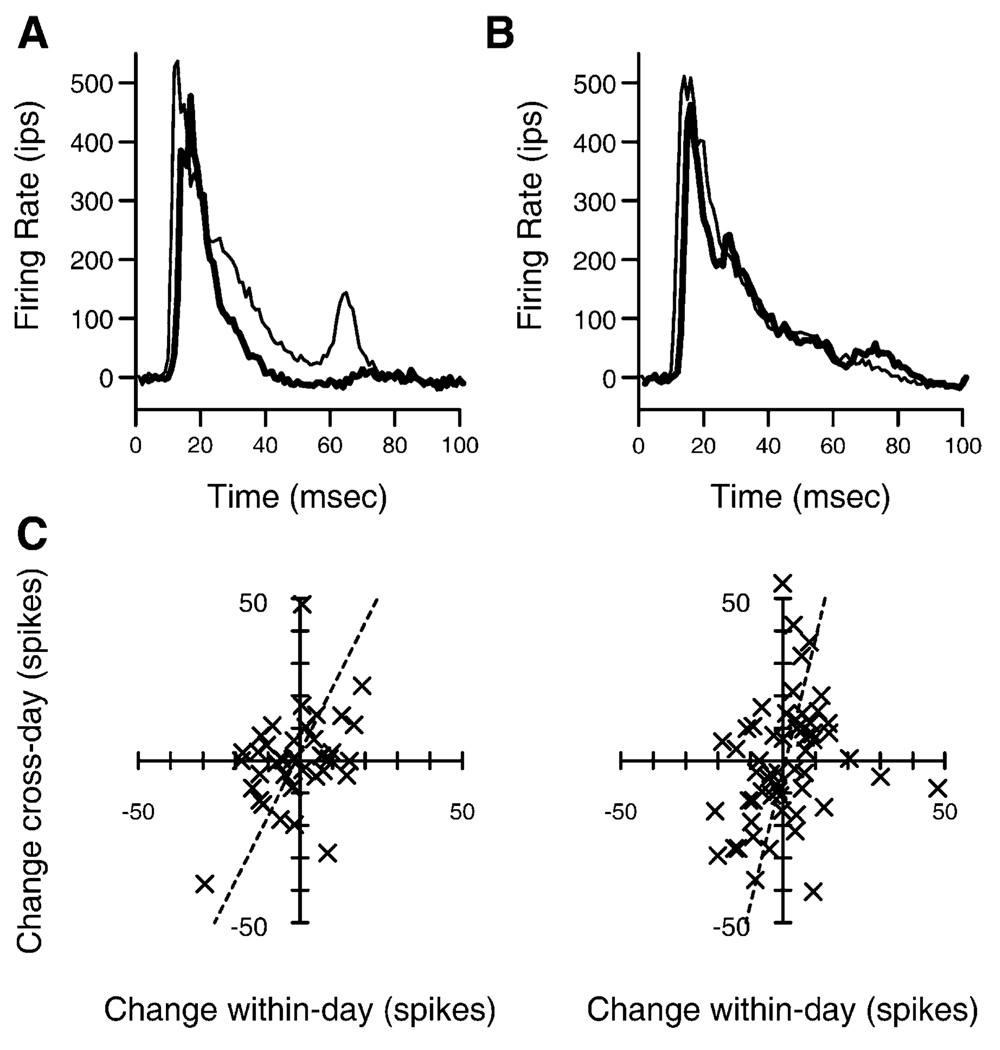
Figure 8. Temporal Plasticity and Neuronal Consolidation.
(A) Population peristimulus time histogram showing the average firing rates after target tonal stimuli in the instrumental learning condition (thick line) and the classical conditioning condition (thin line). Data are from animal two.
(B) Population PSTH in response to non-target frequency stimuli in the same two behavioral conditions from the same neurons. These data show only a portion of all data considered in the cortical excitability measure.
(C) Correlation between within-day target onset response strength changes and across-day changes. Both animal one (left) and animal two (right) show significant positive correlations. A best-fit line is shown for each, and in each case the fit is significantly better than the null hypothesis of equality in change.

