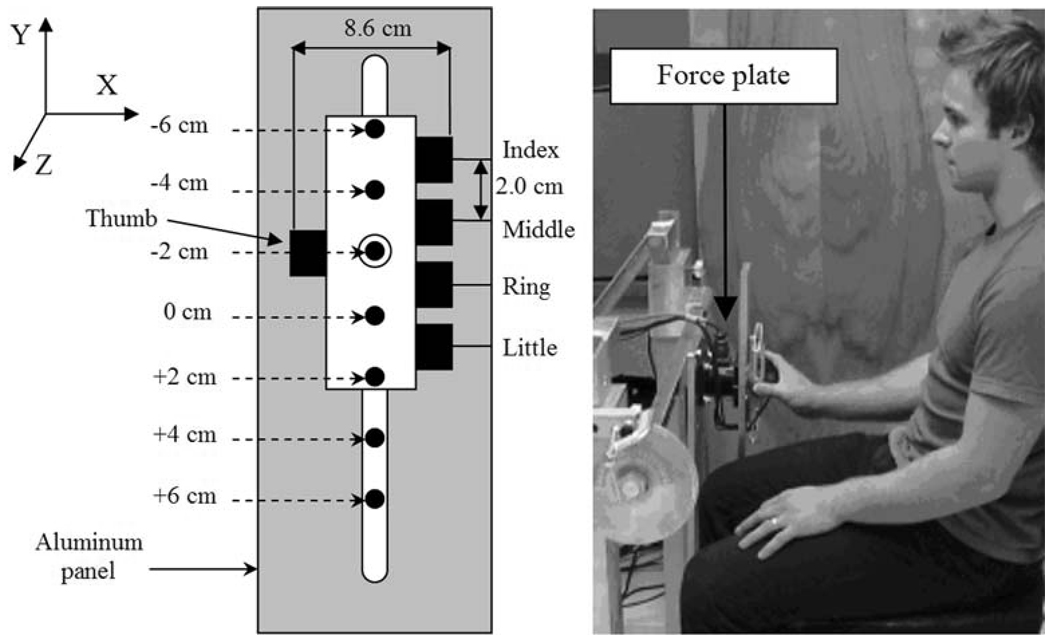
Fig. 1.
Experimental setup. Left panel A schematic representation of the handle (white rectangle) with the force sensors (black rectangles) and the panel (in gray). Seven positions of the axis of moment of the handle (black circular dots) were shown to subjects with a sticky marker. The circle around the black dot signifies center O with respect to which the free moments were computed (described later in the text). The position of the handle in the drawing is at −2.0 cm. Right panel A subject position

