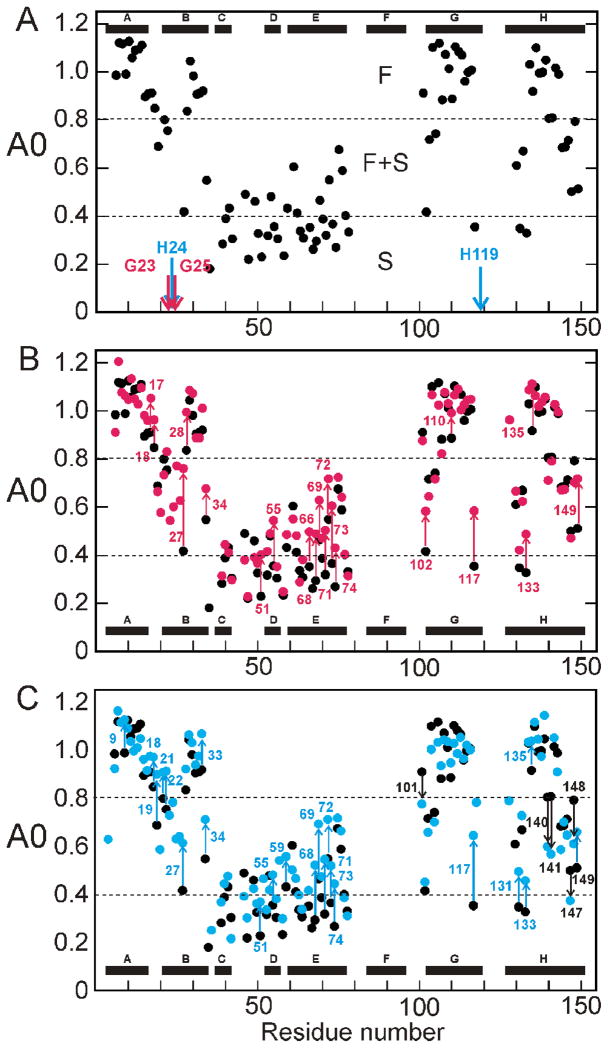
Figure 4.
Proton occupancy (A0) for the burst phase intermediate as a function of residue number. A. wild type (black) showing the mutation sites for the G23A/G25A mutant protein (red arrows) and the H24L/H119F mutant protein (blue arrows). B. Superposition of the wild-type data from part A (black) with that for the G23A/G25A mutant protein. Residues showing a significant change in the mutant are labeled and the extent of the change indicated by arrows, red for increased protection in the mutant and black for decreased protection. C. Superposition of the wild-type data from part A (black) with that for the H24L/H119F mutant protein. Residues showing a significant change in the mutant are labeled and the extent of the change indicated by arrows, blue for increased protection in the mutant and black for decreased protection. A significant change is defined as dA0 (A0mutant – A0wild type) greater than 0.1 or less than −0.1.

