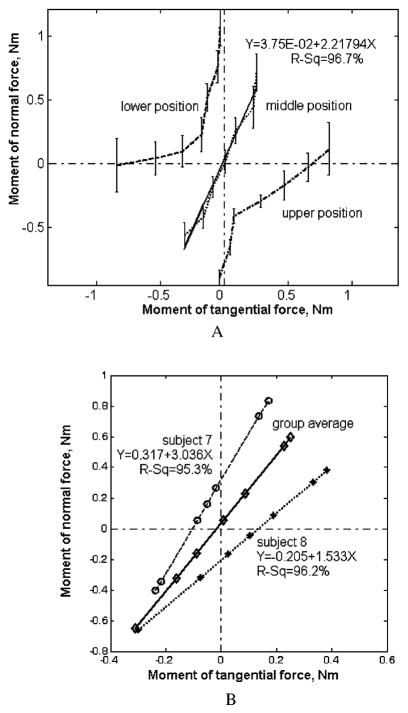
Fig. 5.
Moment of normal forces Tn versus moment of tangential forces Tt for the different torque values. Grip width 60 mm. a Group average at the different thumb positions. Vertical bars indicate standard deviations. For the middle thumb position, the regression line is also shown. b Representative examples for two subjects, middle thumb position. (In the regression equations, Y stands for the moment of normal forces, X is the moment of tangential forces.)

