
Fig. 3.
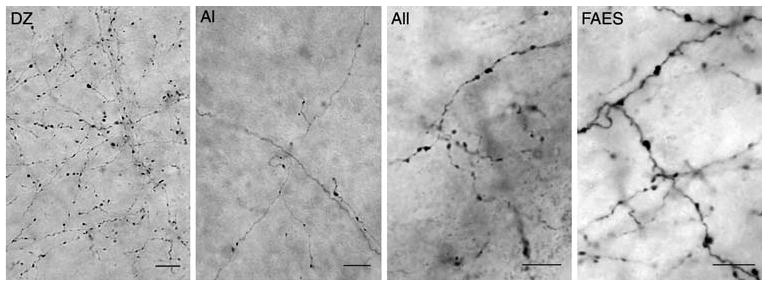
Photomicrographs of auditory cortical projections to visual PLLS. Each image shows BDA-positive axons (thin, wavy black lines) and boutons (black swellings) taken in the PLLS as a result of tracer injection into the indicated auditory cortical region. Abbreviations same as in Fig. 2. Scale bars = 10 μm