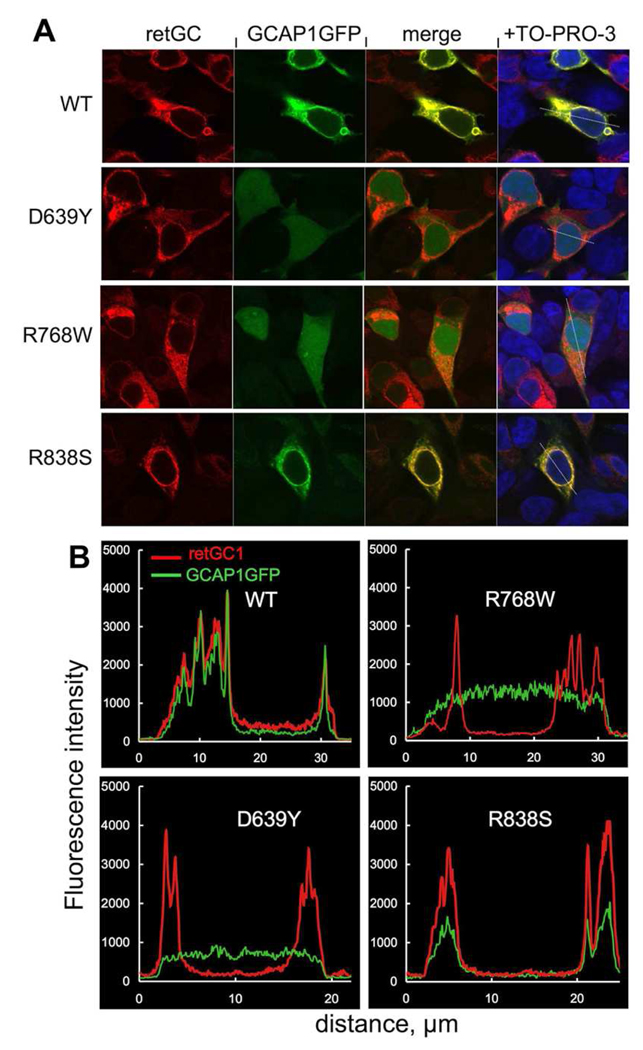
FIG. 3. Cellular localization of GCAP1-GFP co-expressed with RetGC1 mutants.
A. Fluorescence of GCAP1- GFP and RetGC1 (anti-RetGC1KHD primary and Alexa Fluor 568 secondary antibody) in HEK293 co-expressing GCAP1-GFP and wild type (WT) or mutant (D639Y, R768W and R838S) RetGC1. The first two columns show GCAP1-GFP and Alexa Fluor 568 fluorescence, respectively. The third column shows the merged fluorescence images in the first two columns. Rightmost panels show the merged images counterstained with TO-PRO-3 (pseudo blue). The cells were fixed with 4% paraformaldehyde. The GFP fluorescence of GCAP1-GFP was excited at 488 nm and Alexa Fluor 568 antibody complex at 543 nm. For other details see "Experimental Procedures". B. Representative fluorescence intensity profiles recorded from the cells expressing GCAP1-GFP and wild type or mutant RetGC1 along the lines superimposed on the merged fluorescent images shown in the rightmost panels in A.

