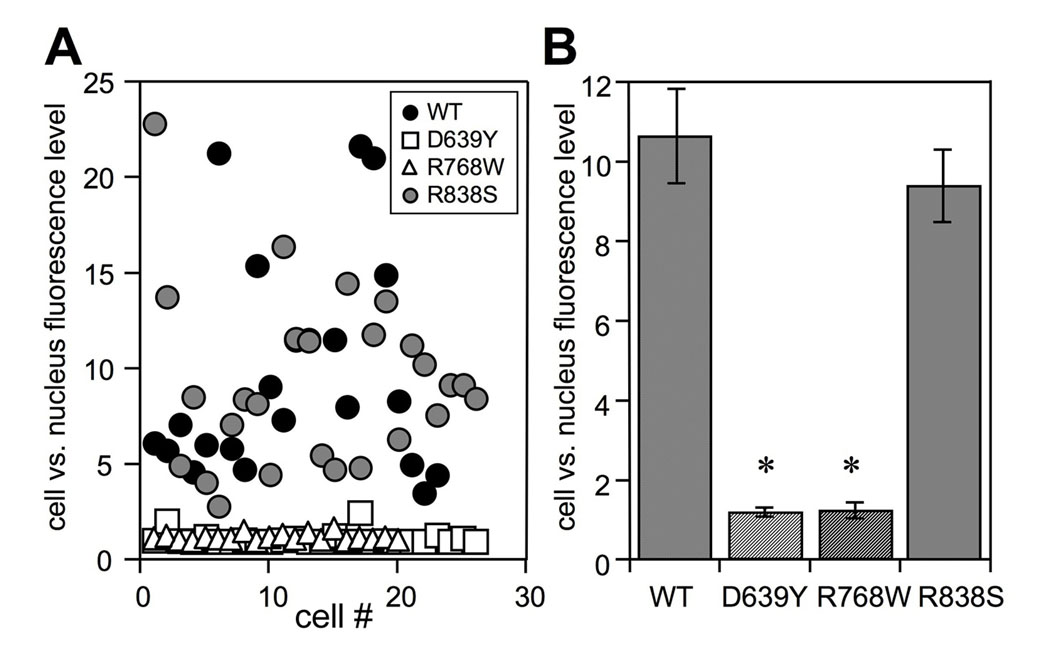
FIG. 4. Effect of RetGC1 mutations on GCAP1-GFP co-localization with RetGC1.
A. The cell:nucleus GCAP1-GFP fluorescence intensity ratio among the HEK293 cells that co-express GCAP1-GFP with WT (●), D639Y (□), R768W (Δ) and R838S ( ) RetGC1. The cell:nucleus fluorescence intensity ratio is the ratio between the maximal GFP fluorescence intensity in the whole cell versus its maximal fluorescence intensity inside the nucleus. Each data point represents a single cell. B. Average ratio (mean ± standard error, cell number) for GCAP1-GFP co-expressed with WT (10.6 ± 1.4, n = 25), D639Y (1.2 ± 0.1, n = 26), R768W (1.2 ± 0.04, n = 20) and R838S (9.3 ± 0.9, n = 26) RetGC1; *p<0.01 different from wild type.

