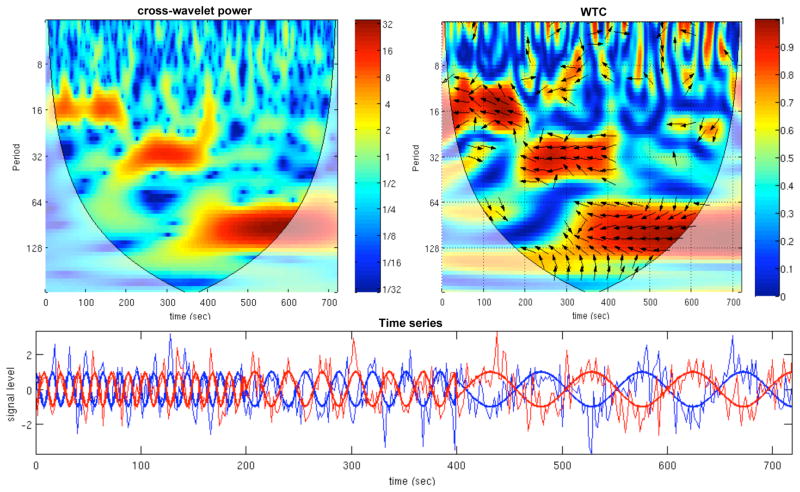
Figure 2.
Example of the cross-wavelet power (above left) and wavelet transform coherence (above right) for simulated data (bottom). The simulated data consist of negatively-correlated sinusoids with piecewise frequency content (f = 1/16 Hz for 0<t<200 sec, f = 1/32 Hz for 200<t<400 sec, and f = 1/96 Hz for 400<t<720 sec; thick lines in figure), embedded in Gaussian white noise (SNR=1.25; thin lines in figure). For the WTC, the phase angle between the 2 time series at particular locations in the time-frequency plane is indicated by an arrow (see text for further detail). Regions inside the cone of influence appear in faded color.

