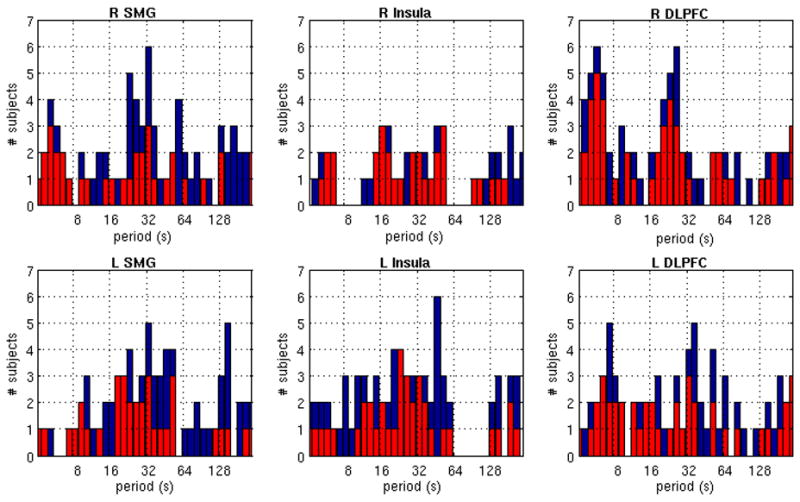
Figure 5.

Significance of temporal variability in the wavelet transform coherence. Each plot shows the number of subjects for which the variance in the WTC between the PCC and the indicated ROI exceeded the 90% (blue) and 95% (red) confidence levels, for each wavelet scale (Fourier period).
