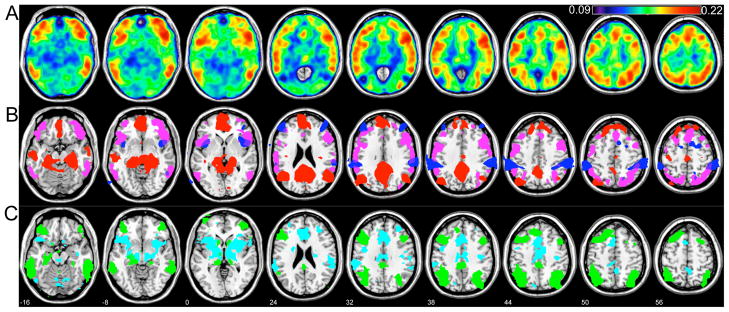
Figure 9.
(A) Variability (standard deviation) over the sequence of 2-min sliding-window correlation coefficients, averaged across all 12 subjects. Five ROIs chosen for further analysis are labeled. (B) t-maps of positive and negative correlations with the PCC (red and blue, respectively, and thresholded identically to Fig. 1), superimposed for anatomical comparison with regions of high variability (SD>0.18; magenta). (C) The intersection of group-level seeded correlation maps (computed across all time points in the scan) using ROIs 1, 2, and 3 as seed regions (green overlay), and using ROIs 4 and 5 as seed regions (cyan overlay). The slice location (z, mm) appears in white numerals and also applies to parts (A) and (B).

