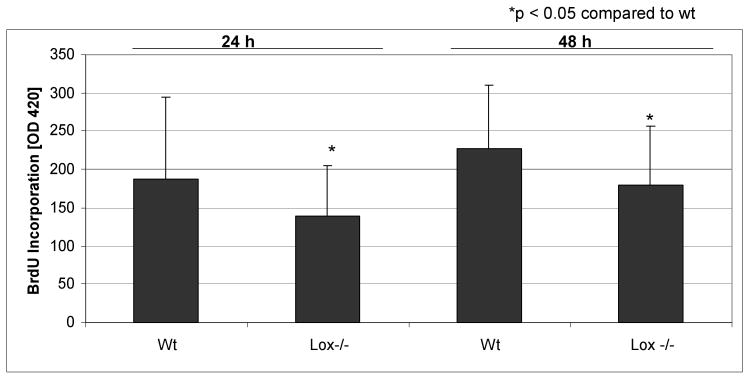
Figure 5.
BrdU incorporation in primary Lox-/- and wt osteoblastic cells after 24 h and 48 h measured by ELISA at 405 nm. Data are presented as means ± SD of three experiments (n = 6 cultures/genotype). Asterisks indicate significant differences between Lox-/- and wt cells (p<0.05; unpaired student's t-test assuming equal variances).

