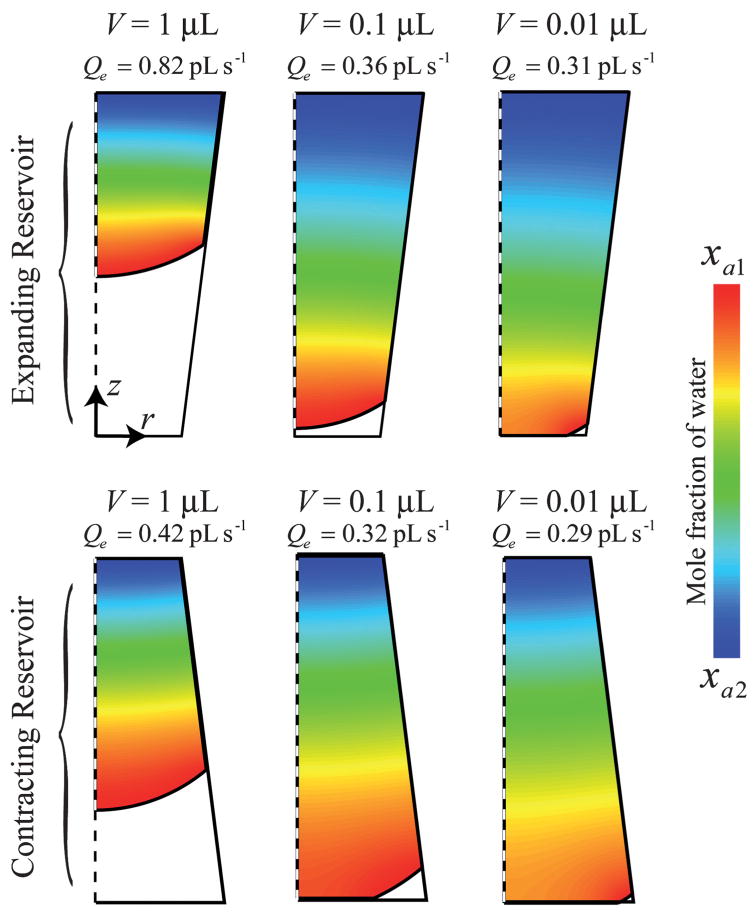
Fig. 4.
CFD simulations displaying the mole fraction of water vapor in several reservoirs with differing volumes. The simulations pertain to a reservoir with θ1 = 25°, θ2 = 50°, H = 2 mm, T = 28 °C, p = 686 Torr, and RH = 25%, with an expanding reservoir (D1 = 1 mm, D2 = 1.5 mm) and a contracting reservoir (D1 = 1.5 mm, D2 = 1 mm).

