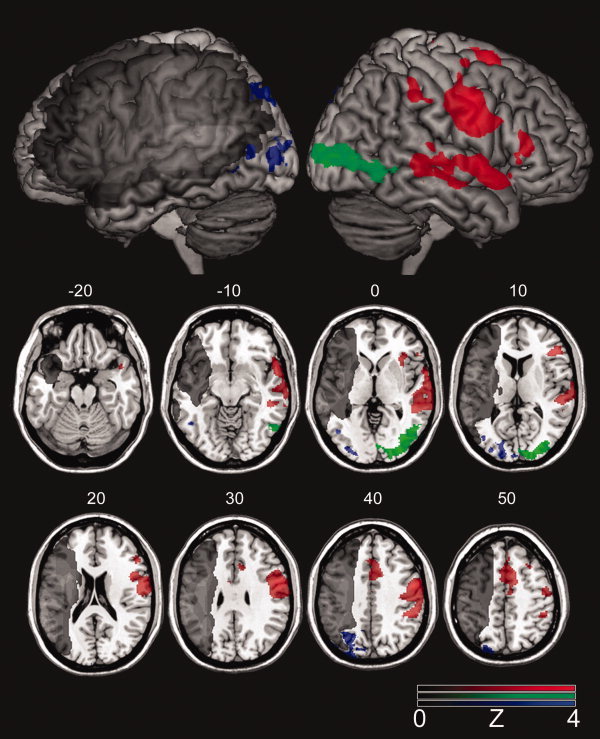
Figure 2.

Brain activity associated with “correct naming > errors” (red‐color scale) as well as for the contrasts “phonemic errors > correct naming” (blue‐color scale) and “semantic errors > correct naming” (green‐color scale). The gradient of the color scale represents Z‐scores compared with baseline. The lesion overlay map is shown in grayscale.
