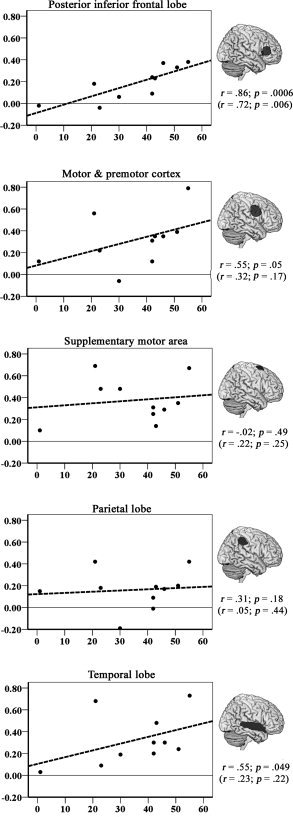
Figure 3.

Scatter plots for the relationship between cortical activity in selective VOIs (Y‐axis; measured as the percent signal change in VOI) and naming performance (X‐axis; measured as the number of correctly named pictures on the fMRI task). The VOIs were extracted from the mean statistical map associated with correct naming (>baseline) in 11 participants and are displayed to the right of each scatter plot (rendered on a standard brain). Spearman correlation coefficients (one‐tailed) for each relationship are shown below each VOI based on data from 10 participants (excluding a single outlier, P3). The same relationship is also shown in parentheses when data from all 11 participants were included.
