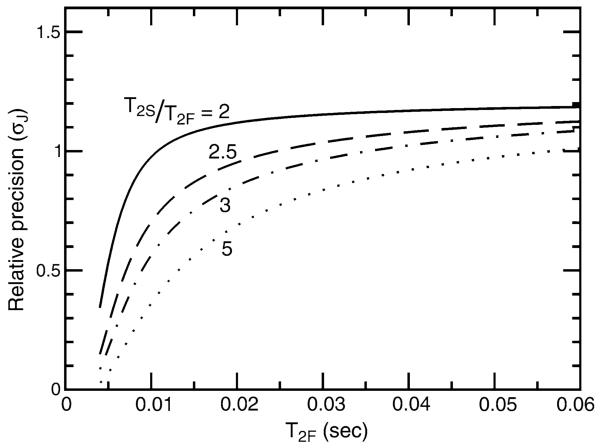
Fig. 10.
Relative precision of 1JNH measurement (σJ) for the J-doubled HNCO versus the κnJ-scaled TROSY-HNCO experiments as a function of the relaxation time of the broad upfield component of the 15N doublet, T2F. Each of the lines corresponds to different ratios of downfield (T2S) to upfield (T2F) relaxation times: T2S/T2F = 2 (solid), 2.5 (dashed), 3 (dot-dashed), 5 (dotted)

