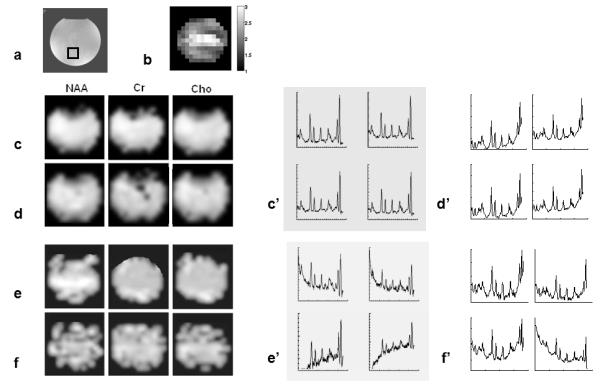
Figure 3.

Comparison of MRSI methods on spherical phantom. (a) MRI of with volume location of spectral arrays shown below, (b) g-factor map for SENSE reconstruction, Spectroscopic images of choline (Cho), creatine (Cr) and N-acetyl-aspartate (NAA) (TR/TE: 2 s/ 11 ms, voxel size: 3 cc) using conventional PEPSI (c), SENSE-PEPSI (d), LBW-PEPSI (e) and single-shot PEPSI (f). The corresponding spectral arrays (c’-f’) display the spectral range from 1.8 to 4 ppm.
