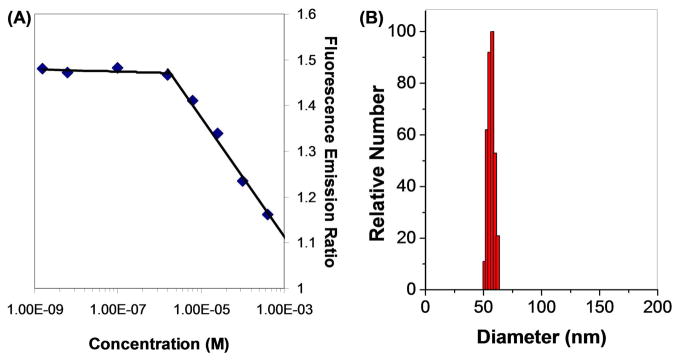
Figure 1.
(A) Ratio of fluorescence emission of pyrene at 373 nm to 383 nm (λexc = 340 nm) vs. log of concentration of dextran-DSPE (spectra found in Figure S2). This ratio indicates a change in pyrene monomer vibronic band intensities that correlates with a change in pyrene solvent environment, or in this case micelle formation. The inflection point in the curve indicates a Critical Micelle Concentration of ca. 1.8 μM. (B) Dynamic Light Scattering of 200 μM 1 in water shows assemblies of 70 nm in diameter, with an average particle polydispersity of 0.100.

