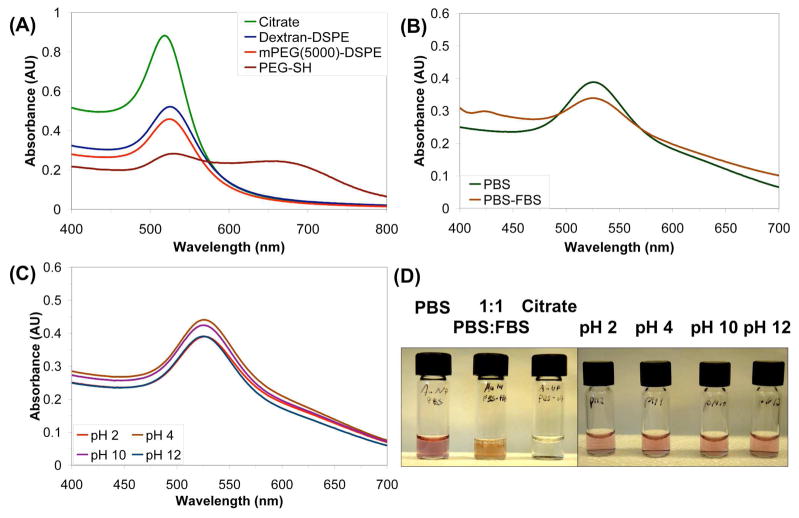
Figure 4.
(A) UV-Vis absorption spectra of 20 nm AuNPs suspended by 1 (blue), mPEG(5000)-DSPE (red), and PEG-thiol (brown) in water. Excess polymer has been washed away four times for 1 and mPEG(5000)-DSPE, while the PEG-thiol has only been washed twice. The large peak at 660 nm for PEG-thiol is due to NP aggregates in the suspension formed after removal of excess PEG-thiol from the solution. (B) UV-Vis spectra of 20 nm AuNPs suspended by 1 in PBS (green) and 1:1 PBS:FBS (brown). The small peak at 425 nm is due to the large absorbance of FBS in this region. (C) UV-Vis spectra of 20 nm AuNPs suspended by 1 after excess polymer removal at pH 2 (green), 4 (brown), 10 (purple) and 12 (red). (D) Photographs of solutions depicted in (B) and (C). The orange color in the PBS:FBS solution comes from the pink AuNPs and the yellow serum, and the aggregated citrate-suspended particles can be seen at the bottom of their vial.

