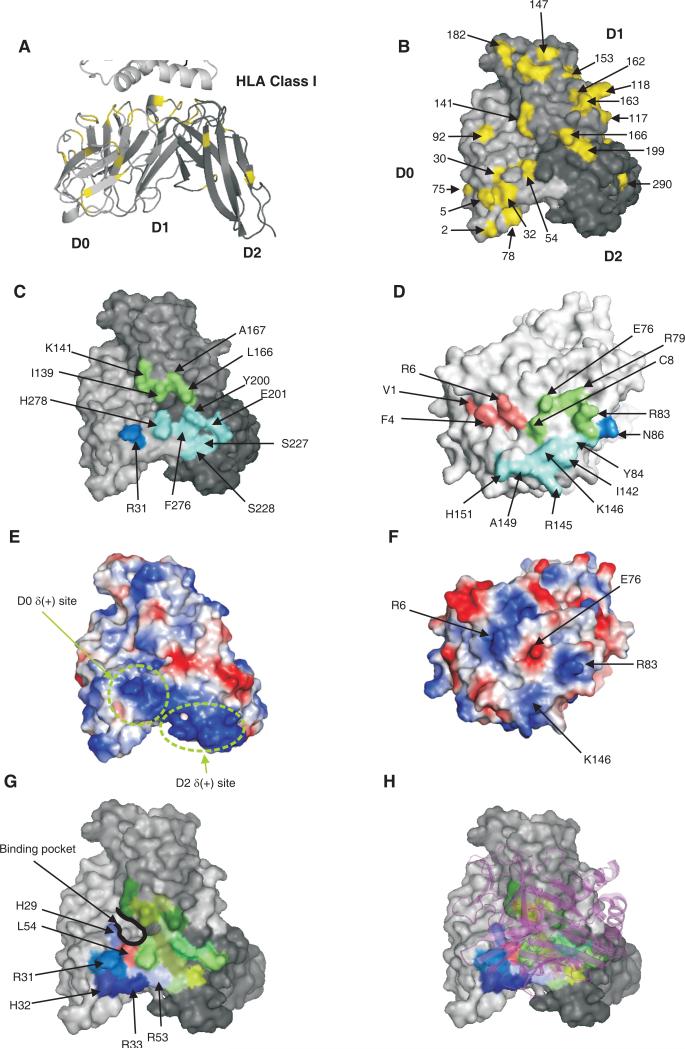
Figure 8. Model for the binding of HLA-A*2402 to 3DL1*015.
A shows a cartoon representation of the KIR3DL1 model. B, C, E, G, and H are surface representations of KIR3DL1 viewed from the bottom of the D1-D2 domain elbow. D and F are surface representations of HLA-A viewed from the top of the peptide-binding groove. A and B show polymorphic amino acids of 3DL1/S1 mapped in yellow onto the D0, D1 and D2 domains of the 3DL1*015 model. C shows the footprint of A*2402 on the surface of 3DL1*015. Blue, green and cyan denote respectively the D0, D1 and D2 domains buried by HLA-A. D shows the footprint of 3DL1*015 on the surface of A*2402. Blue, green and cyan denotes the A*2402 residues contacted respectively by the D0, D1 and D2 domains. Peptide contacting residues are colored in pink. E and F show the electropotential surfaces of 3DL1*015 and A*2402. Red and blue colors represent negative and positive electrostatic potential, respectively. The junction of the electropositive regions of the D0 [D0δ(+)] and D2 [D2δ(+)] domains result in a large electropositive area. Basic residues of A*2402 (arginine 145 and arginine 83) interact with acidic residues of 3DL1*015 (glutamate 201 and glutamate 282) to form salt bridges. The interaction between arginine 83 of HLA-A is the basis for the Bw4 specificity of KIR3DL1 (7). G shows the binding pocket defined by domains D0, D1 and D2 of KIR3DL1. The electropositive stretch of amino acids (29-32) is shown in shades of blue. Residue 54 at the base of binding pocket is shown in red. H shows the HLA ribbon structure in purple superimposed on the binding pocket.

