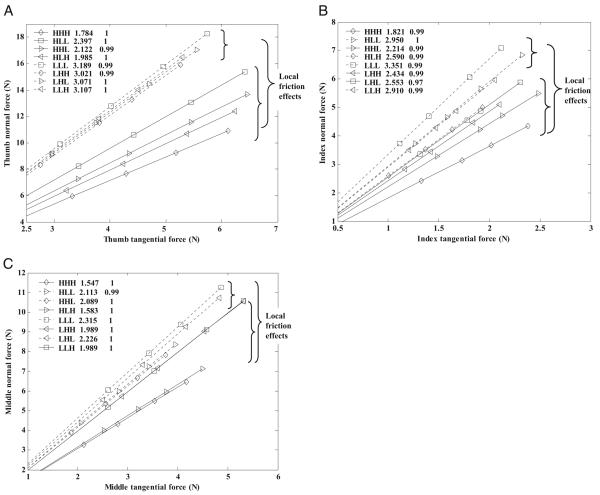
Fig. 5.
Normal digit forces as a function of tangential forces for different friction sets. Group averages. Dotted lines represent the low-friction contacts at the corresponding digits; the solid lines, high-friction contacts. Numbers in the figures are the coefficients (regression slopes) and the coefficients of correlation squared (r2). Rightmost figure brackets: regression line scattering arising from the local friction effects. Leftmost figure brackets: spreading of the lines at the same local friction (the synergic effects).

