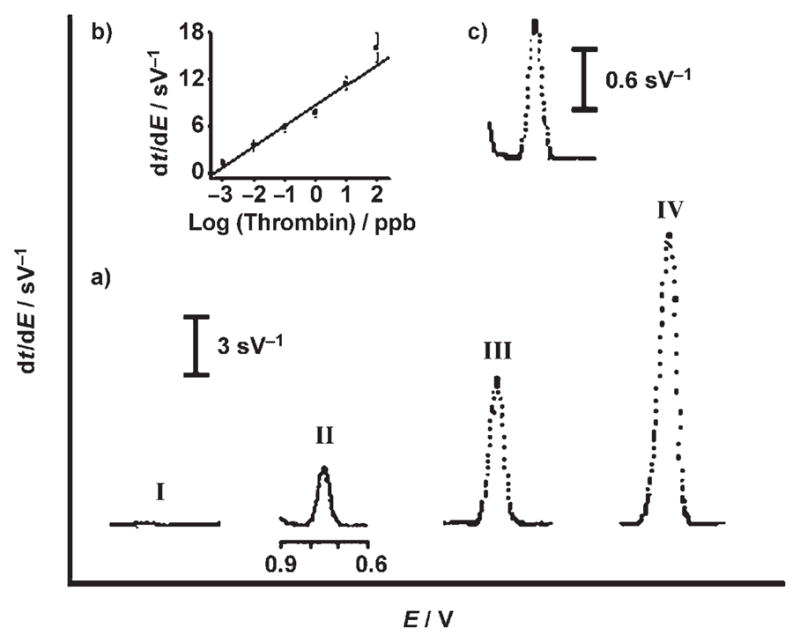
Figure 3.

a) Chronopotentiometric signals for increasing thrombin concentrations: 0 ng mL−1 (I), 0.01 ng mL−1 (II), 1 ng mL−1 (III), and 100 ng mL−1 (IV). b) The resulting calibration plot for thrombin over the 0.001 to 100 ng mL−1 range. c) Response for 1 pg mL−1 thrombin. Other conditions, as in Figure 2.
