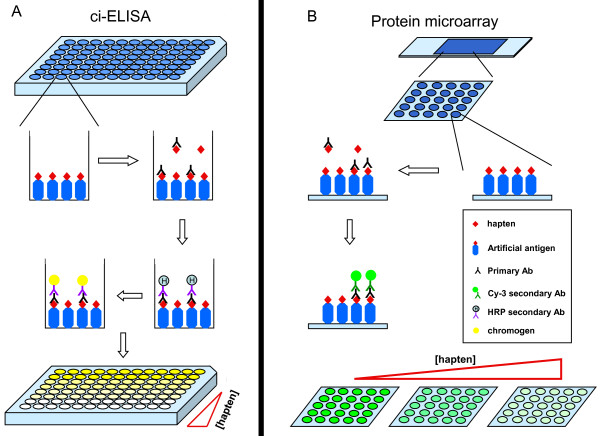
Figure 1.
Schematics of the ci-ELISA and protein microarray procedures. 5 μg of the artificial antigens (CL or SM2) are coated onto the 96-well plates in (A) ci-ELISA, or 20 ng of the artificial antigens were spotted onto the protein microarray slides in (B) protein microarray. Antibodies against the particular artificial antigens are added together with a range of concentration of the corresponding hapten. As the haptens would compete with the immobilized artificial antigens for binding to the antisera, an increasing concentration of the hapten would result in a decreasing signal. For ci-ELISA, the bound antibodies are visualized by an anti-rabbit-HRP conjugated antibody with the addition of a chromogen (A). For the protein array, the secondary antibodies are conjugated to a fluorescent dye (Cy3), and the signal can be directly measured by a fluorescence microarray scanner (B).

