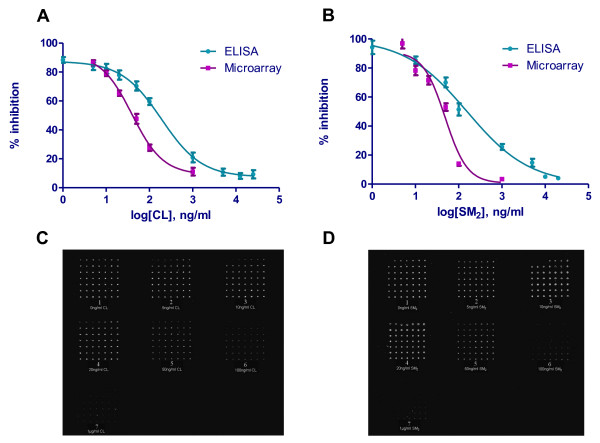
Figure 2.
IC50 of protein microarray immuntodetection and ci-ELISA. Upper panels: Dose-response curves for (A) CL and (B) SM2 from ci-ELISA and protein microarray. The log of the hapten concentration (x-axis) was plotted against the percentage of inhibition (y-axis), which is (ODsample/ODcontrol) × 100%. The control group OD was considered to be the point of 100% activity. The IC50 was determined by non-linear regression analysis. Lower panels: fluorescent signals from the protein microarray slides for (C) CL and (D) SM2. The concentration of the standard solution for each slide is: 1: 0 ng/ml; 2: 1 ng/ml; 3: 5 ng/ml; 4: 10 ng/ml; 5: 20 ng/ml; 6: 100 ng/ml; 7: 1000 ng/ml.

