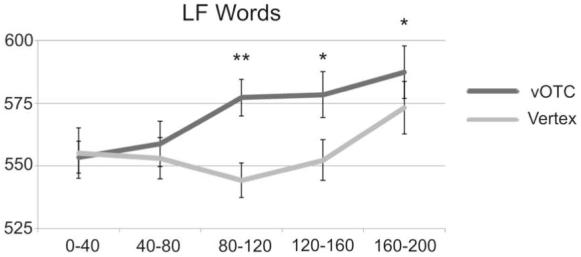
Figure 4.

Mean RTs (in msec) for TMS of vOTC (dark bars) and Vertex (light bars) over 5 time windows, with error bars representing corrected standard error of the means (Loftus & Masson, 1994). ** indicates a significant difference for vOTC stimulation from the 0-40msec time window at p<0.01; * indicates p<0.05.
