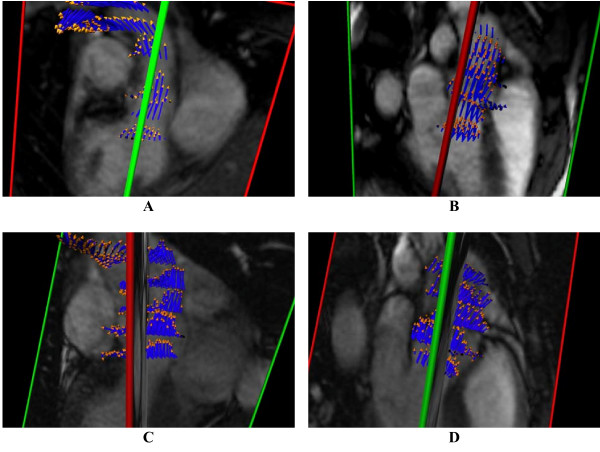
Figure 2.
3-D reconstructions of aortic blood flow during peak systole (A,B) in a normal subject with tricuspid aortic valve, showing a centrally directed systolic flow jet, and (C,D) in a BAV patient with aortic dilatation, showing anteriorly directed off-axis systolic flow. The images in each pair of views mutually cross-reference the location of the perpendicular slice by the color of the intersection lines. The intersection line is ideally located along the LVOT channel axis but this scan planning does not necessarily work out perfectly in all cases, so in the analyses this direction is recalculated (see Figure 3).

