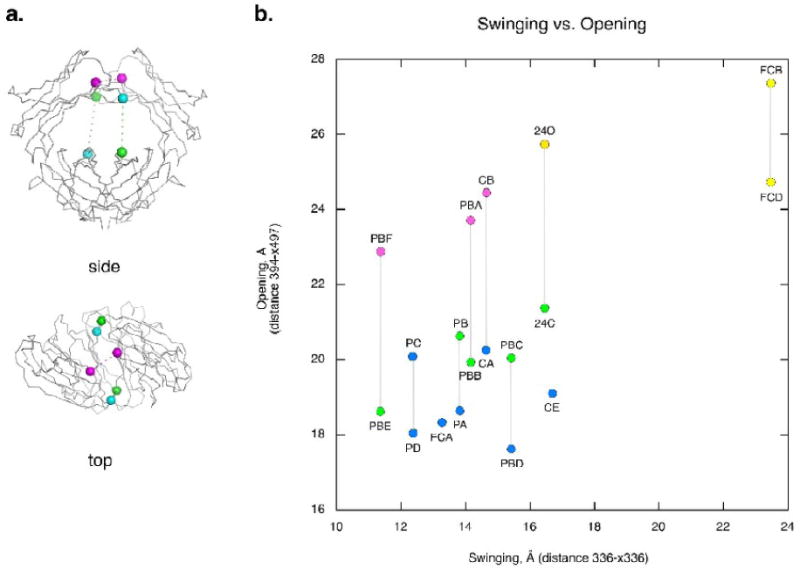
Figure 3.

The open-to-closed and swing motions of the C3 domains. (a) A schematic showing how the swing (horizontal) and open-closed (vertical) motions of the IgE-Fc subunits are measured. The swing distance is measured between the Cαs of residue 336 in each dimer (336-x336). The vertical open-to-closed distance is measured from the Cα of residue 394 of one chain to the Cα of residue 497 of the other chain in the dimer pair (394-x497). (b) A plot of the swing vs. the open/closed motion of the IgE-Fc chains. All distances are given in Å. Chain conformation is indicated by color: open (yellow), intermediate (pink), closed-b (green) and closed-a (blue). Gray vertical lines indicate members of the dimer pair except for FCA and CE which are symmetric dimers. Subunits from the different crystals are named by their crystal form and their chain letter. Subunits from new crystal forms include C2's CA, CB, and CE chains, P21's PA, PB, PC and PD chains and P21 big's PBA, PBB, PBC, PBD, PBE and PBF chains. Previously published crystal structures include the closed Fc (FCA), the Fc bound to the soluble FcεRI alpha chain (FCB and FCD), and the intact Fc2-4 structure closed (24C) and open (24O) chains
