
Figure 2.
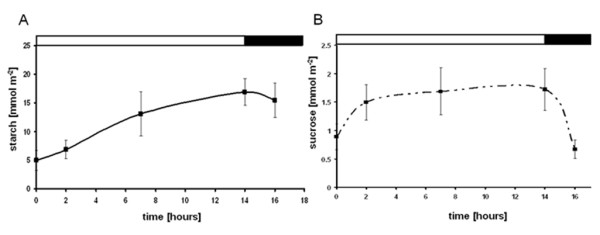
Diurnal starch and sucrose content of leaves over a sixteen hour period. A) Starch and B) sucrose content. Error bars indicate standard deviation (n = 3).
Official websites use .gov
A
.gov website belongs to an official
government organization in the United States.
Secure .gov websites use HTTPS
A lock (
) or https:// means you've safely
connected to the .gov website. Share sensitive
information only on official, secure websites.
Diurnal starch and sucrose content of leaves over a sixteen hour period. A) Starch and B) sucrose content. Error bars indicate standard deviation (n = 3).