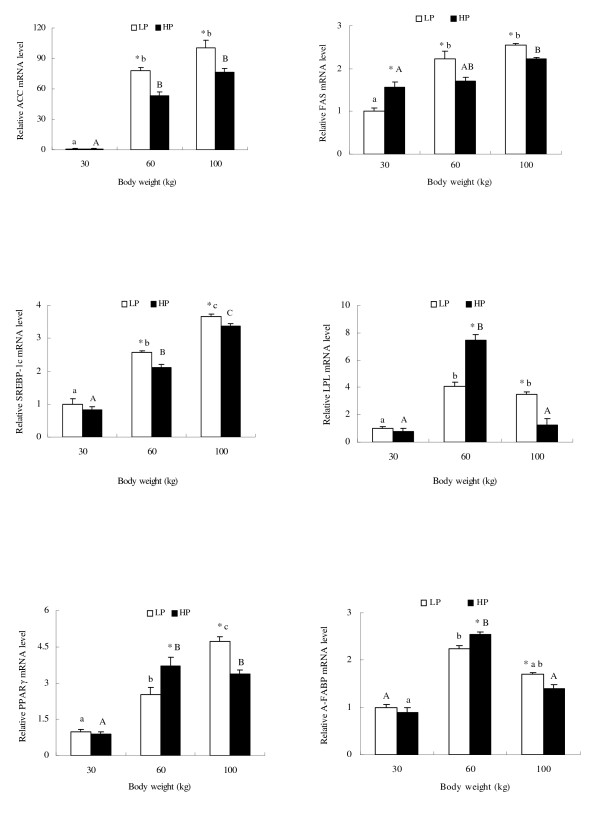
Figure 2.
Relative mRNA abundance of lipogenic genes in adipose tissues at 30, 60 and 100 kg body weights of pigs fed high and low dietary protein, based on extraction of total RNA and subsequent real-time PCR analysis. Means ± SE without common letter differ significantly between body weight groups (lower case for LP group and upper case for HP). * indicates treatment differences at the same body weight (P < 0.05).

