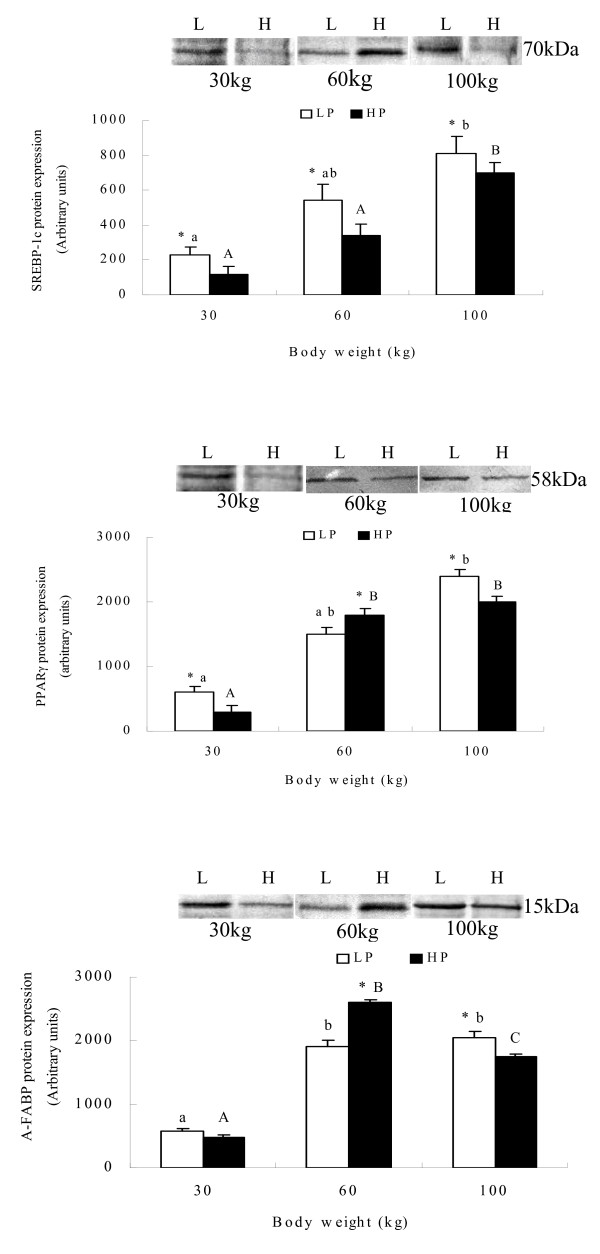
Figure 4.
Protein expressions in adipose tissues at 30, 60 and 100 kg body weights of pigs fed high and low dietary protein. Means ± SE without common letter differ significantly between age groups (lower case for LP group and upper case for HP). * indicates treatment differences at the same body weight (P < 0.05).

