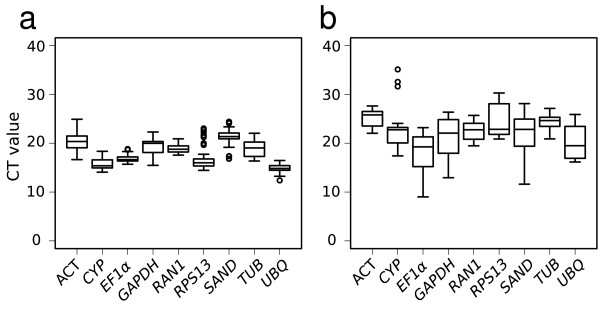
Figure 3.
Expression profiling of reference genes in different organs and Petunia lines. CT values are inversely proportional to the amount of template. Global expression levels (CT values) in the different lines tested are shown as 25th and 75th quantiles (horizontal lines), median (emphasized horizontal line) and whiskers. Whiskers go from the minimal to maximal value or, if the distance from the first quartile to the minimum value is more than 1.5 times the interquartile range (IQR), from the smallest value included within the IQR to the first quartile. Circles indicate outliers, the values smaller or larger than 1.5 times the IQR.

