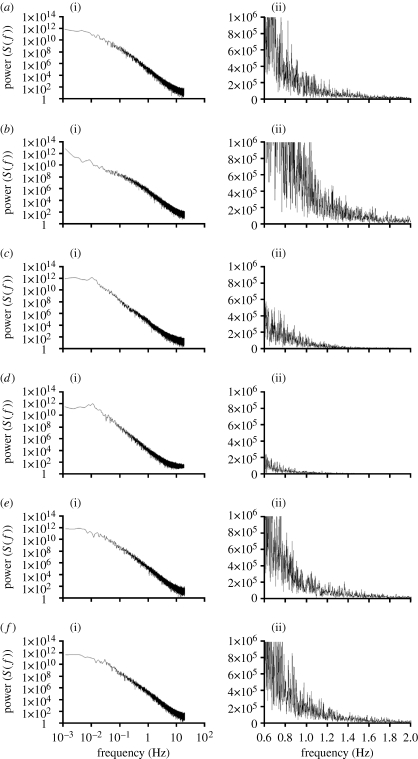
Figure 6.
Power spectral analysis of bacterial chemotaxis. Two charts are shown for each simulation: (i) full log–log plot and (ii) linear plot of 0.6–2 Hz. Bacterial genotypes and gradient conditions for each simulation are given in table 1. (a) X30-5, (b) X33-7, (c) X33-5, (d) X33-3, (e) X32-1 and (f) X32-3.

