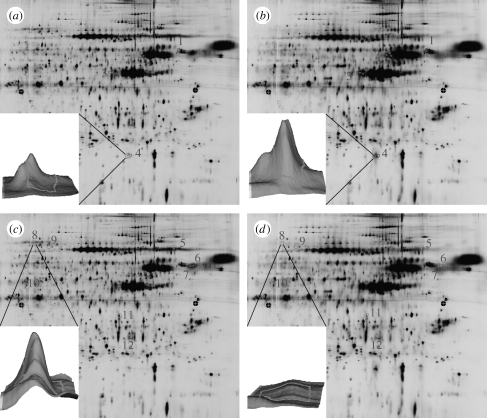
Figure 7.
Typical DIGE images as analysed by DeCyder Image Analysis Software. (a,c) The images of proteins labelled by Cy3 and (b,d) the images of proteins labelled by Cy5. Peak volumes of each spot were compared with each other. A twofold difference in peak volume was used as a cut-off to determine the difference in protein expression between the test and the control. In all DIGE gels, there were areas showing results of up- and downregulation. These spots were used for protein identification.

