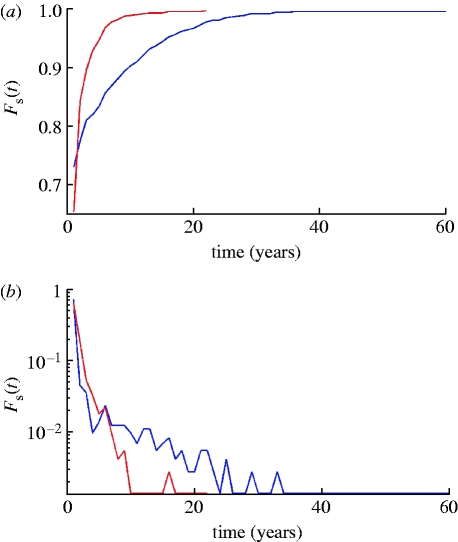
Figure 10.
Comparison of strain lifetime distribution, Fs(t) (a), and density, fs(t) (b), functions for models with (red curves) and without (blue curves) transient strain-transcending immunity. Duration of transient immunity is taken to be 0.5 year. Other model parameters are the same as in figure 9.

