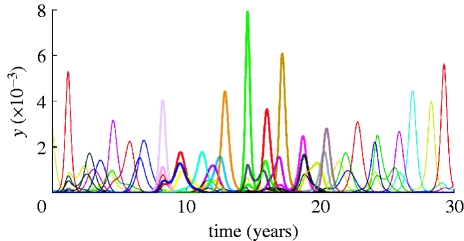
Figure 7.
Sample time series for the proportion of infected population (300 million population model, R0=2, σ=50 per year; cross-immune response function, γ(d), is defined by the parameters a=0.45 and b=0.9). A few peaks corresponding to different strains are plotted in bold showing sequential strain replacement. The duration of strain-transcending immunity is 0.5 year.

